Variable Rate Sowing Cereals
- Optimize your sowing with satellite images
- Fully exploit yield potential
- homogeneous stand
How to use the tool
Register in myKWS
Login to myKWS. If you don't have an account yet, you can register for free. Enter the necessary data to be able to use this top tool.
Create plots
Activate the voucher in the tool using the codes you receive from your KWS consultant. Then create your plots for your chosen cereals crop. You can draw the plot boundaries manually or import them. Add your sowing details too.
Maps for variable sowing
After creating the plots, you receive a specific assessment of the production capacity of your land based on satellite images recorded over several years. The calculation process can take up to 24 hours.
Frequently asked questions about variable rate sowing
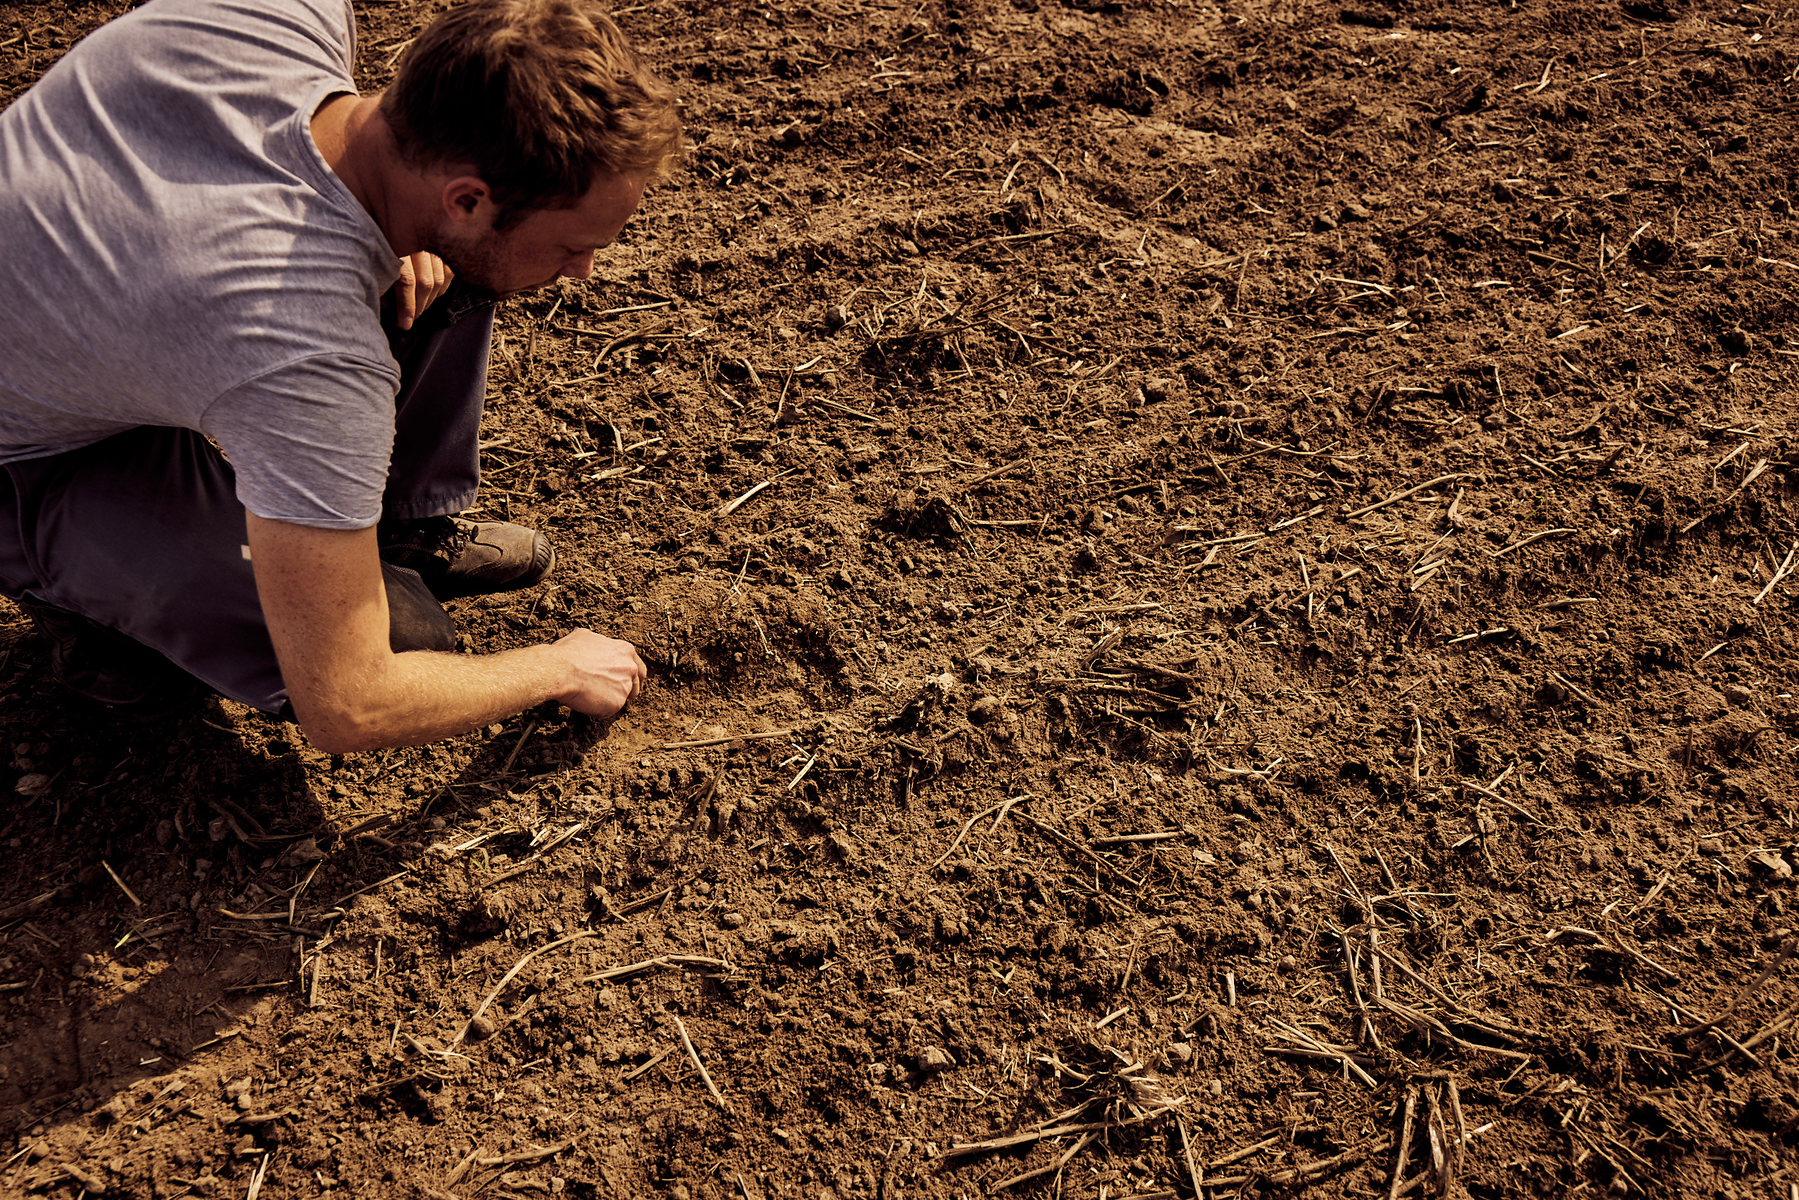
Arable land is heterogeneous. Soil types and soil properties vary within a field. Some subplots always offer sufficient water and good growing conditions - other subplots less so.
You can react to these differences in the area by adjusting the seed rate. With sub-area-specific sowing, you can adapt the sowing rate everywhere to the particular soil conditions of your area.
Because site-specific sowing varies the seed rate in the area on the basis of a map, an electronically controlled seeder is necessary. A GPS system for orientation on the field and a terminal for control are also necessary. The seed maps are loaded onto this terminal.
If you don't have such technology the maps that you can see in our platform are a good indication of the potential in your field and can be as interesting.
The system is free of charge. However, you need a voucher code to activate the area.
The more precisely the field boundaries are drawn in, the better the later assessment of the yield capacity will be. You should pay particular attention to drawing in field islands, such as groups of trees within the field, with the polygon tool. You should also make sure that forest edges are drawn in as accurately as possible.
You can obtain voucher codes from your local KWS cereals consultant. Feel free to ask your consultant about it.
In addition to drawing in the field boundaries manually, you can also import field boundaries from your agricultural application or your field boundary index. The file formats Shape and KML are supported.
After creating the plots, an automatic calculation process takes place. In this process, satellite images of the last 5 years are calculated. Differences in biomass are considered and thus the yield capacity of the sub-area is concluded. You will receive an e-mail and a notification at the beginning and at the end of the calculation. The calculation process takes some time and can take up to 24 hours.
The result of the calculation process is the so-called classification map and represents an assessment of the sub-area-specific yield capacity. This map is created individually for each field. Therefore, zones within a field can be compared very well. Different plots, however, are less easy to compare.
The classification map is based on the minimum and maximum biomass on average over the last 5 years. Whenever the biomass on partial plots deviated significantly from the rest of the plot in the last 5 years, not due to soil effects, but due to other effects, this should be taken into account in the subsequent sowing zones. This includes land division and separate cultivation, as the biomass on the subplots has always been different due to separate cultivation. Other examples are beet heaps or flower strips. Therefore, when interpreting the map, you should take the field history into account and, if necessary, manually adjust the sowing zones accordingly.
Satellite data from the last five years are used to calculate the classification maps. As the biomass on the subplots usually also differs significantly in the case of split management, this has a direct effect on the classification map. Biomass differences due to different soil properties can then be clearly overlaid by differences in management practices. Subsequently, in this form, the map does not reflect the site-specific yield capacity of the soils. This applies to all differences in management practices over the last five years and applies not only to a classical division of the field, but also to flower strips or similar. In such cases, the sowing zones should be checked after the classification has been calculated and, if necessary, adjusted manually.
Based on your personal experience and your information regarding variety, soil type, sowing date, direction of us, you can individually type in the seed strength. Depending on the number of classes selected, you can choose between 3 and 5 different seed strengths per field. You can change the number of classes at any time. You can also change the seed strength per seed class at any time.


