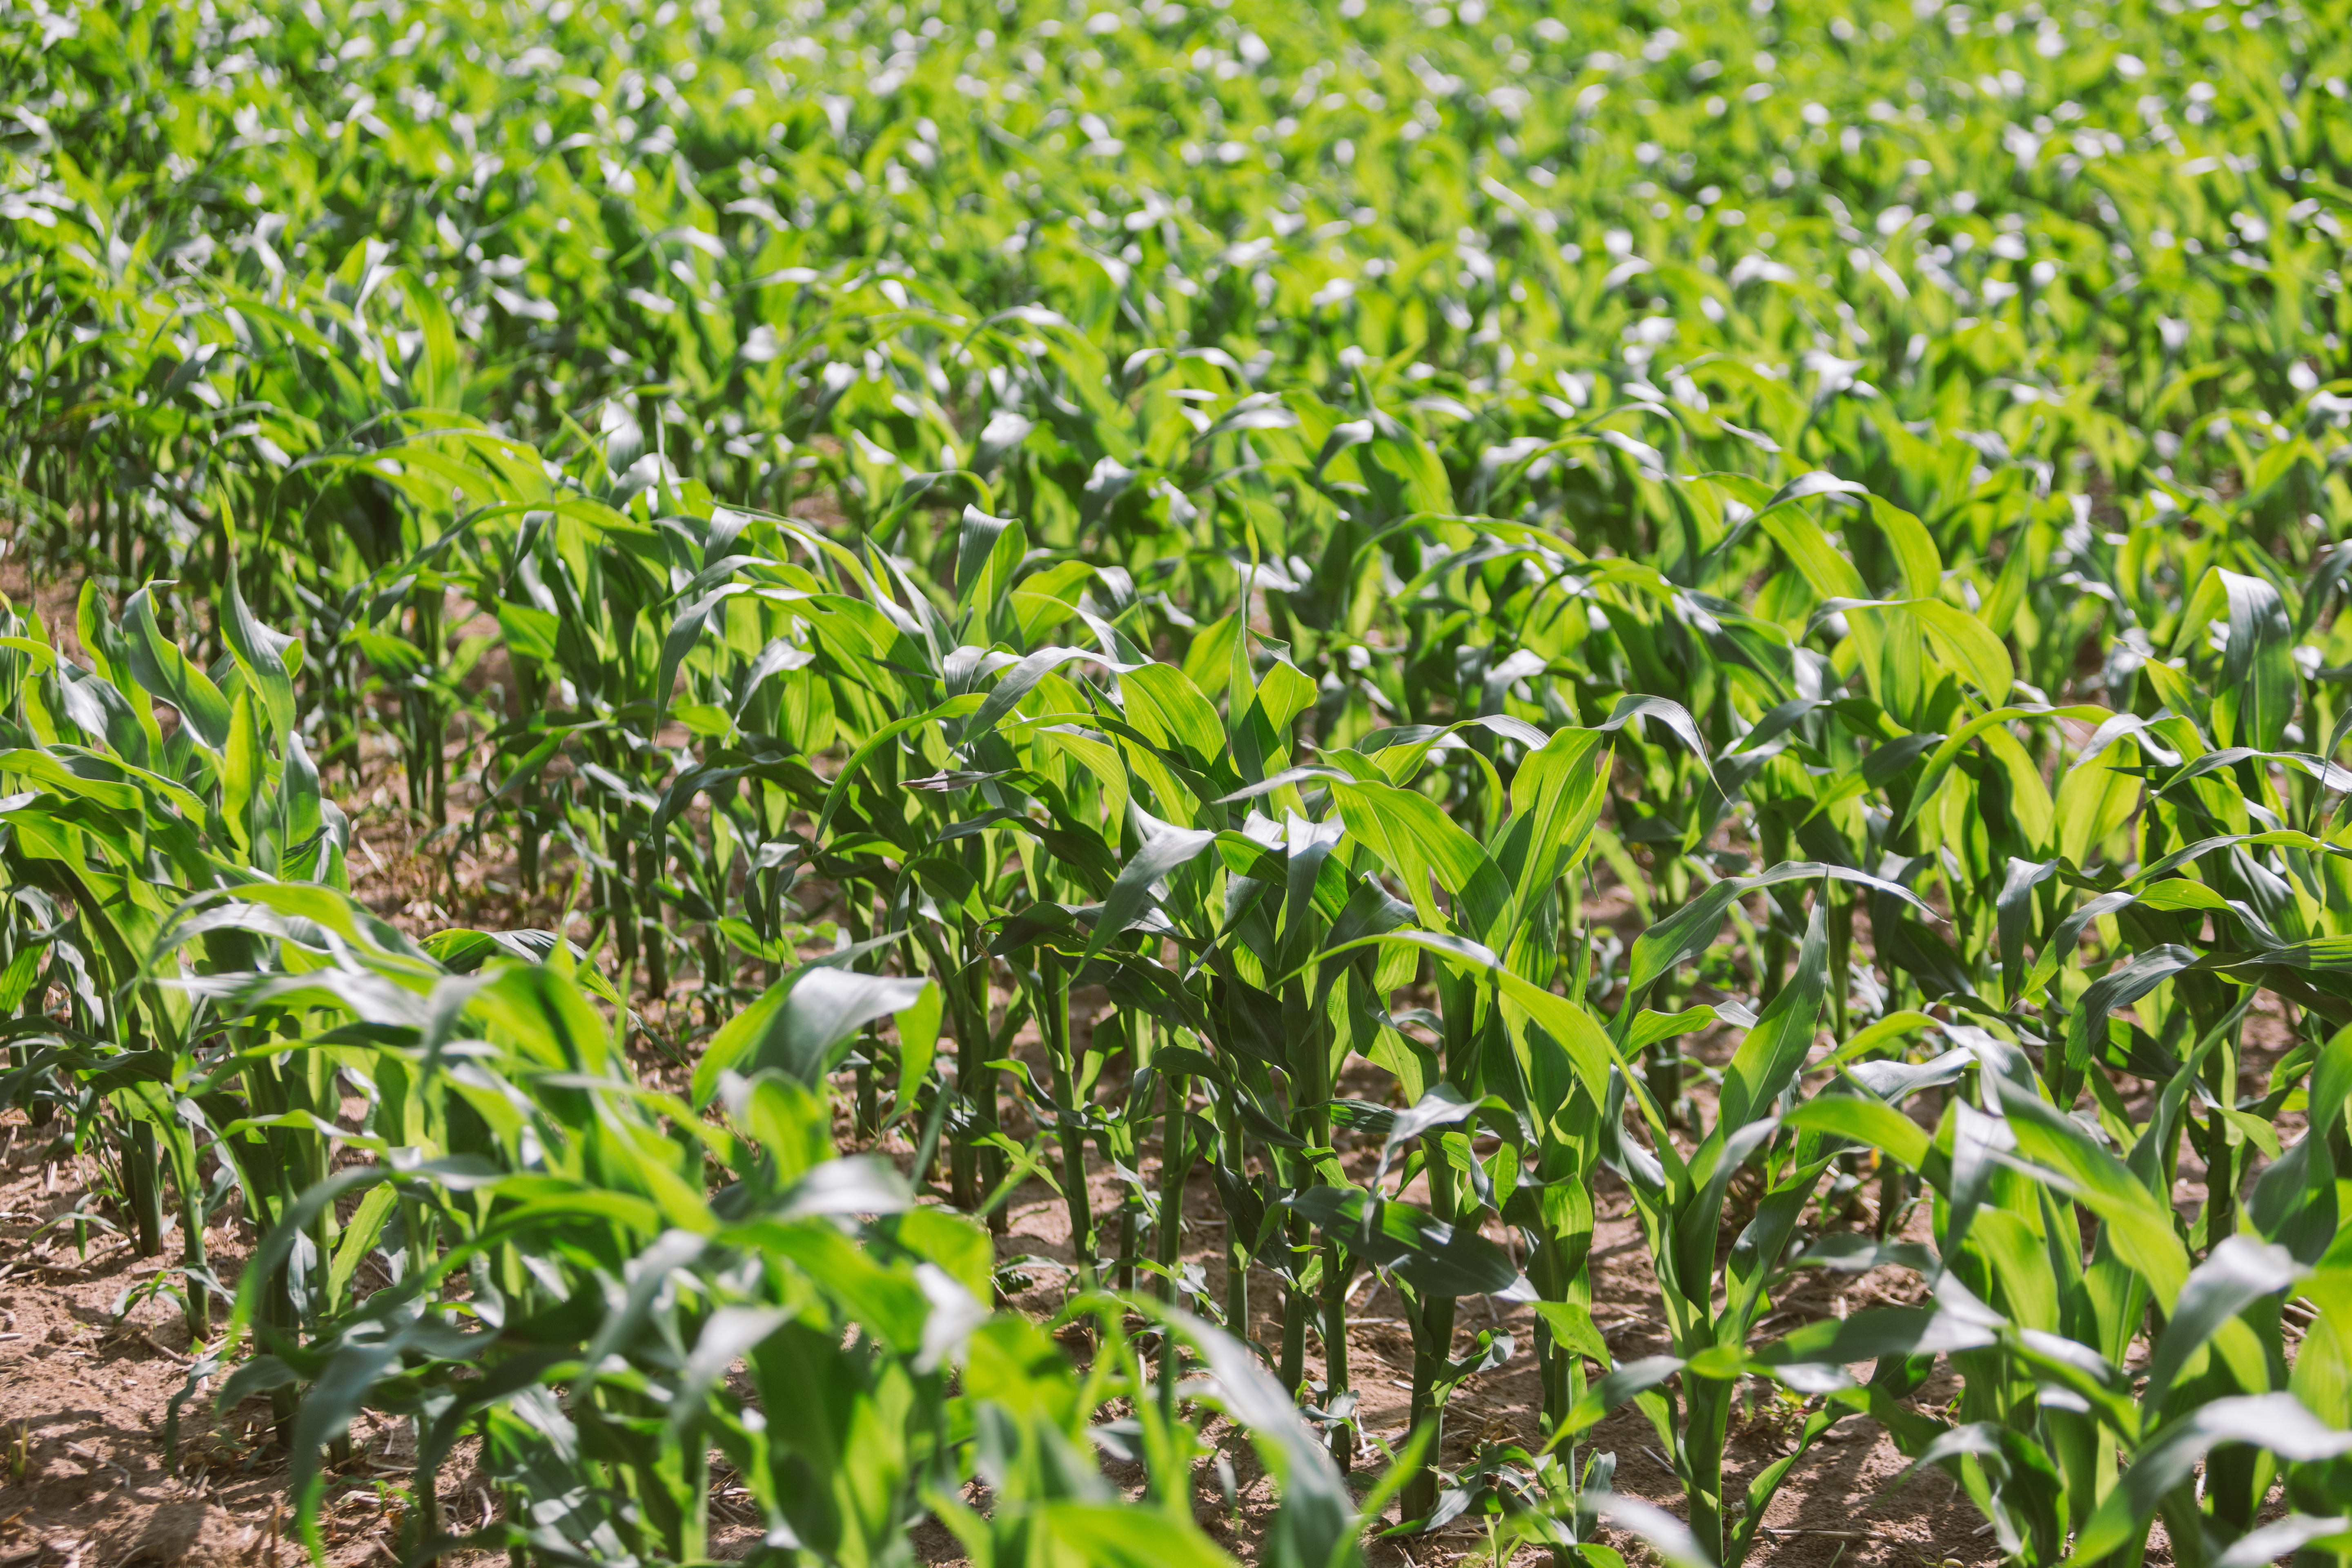
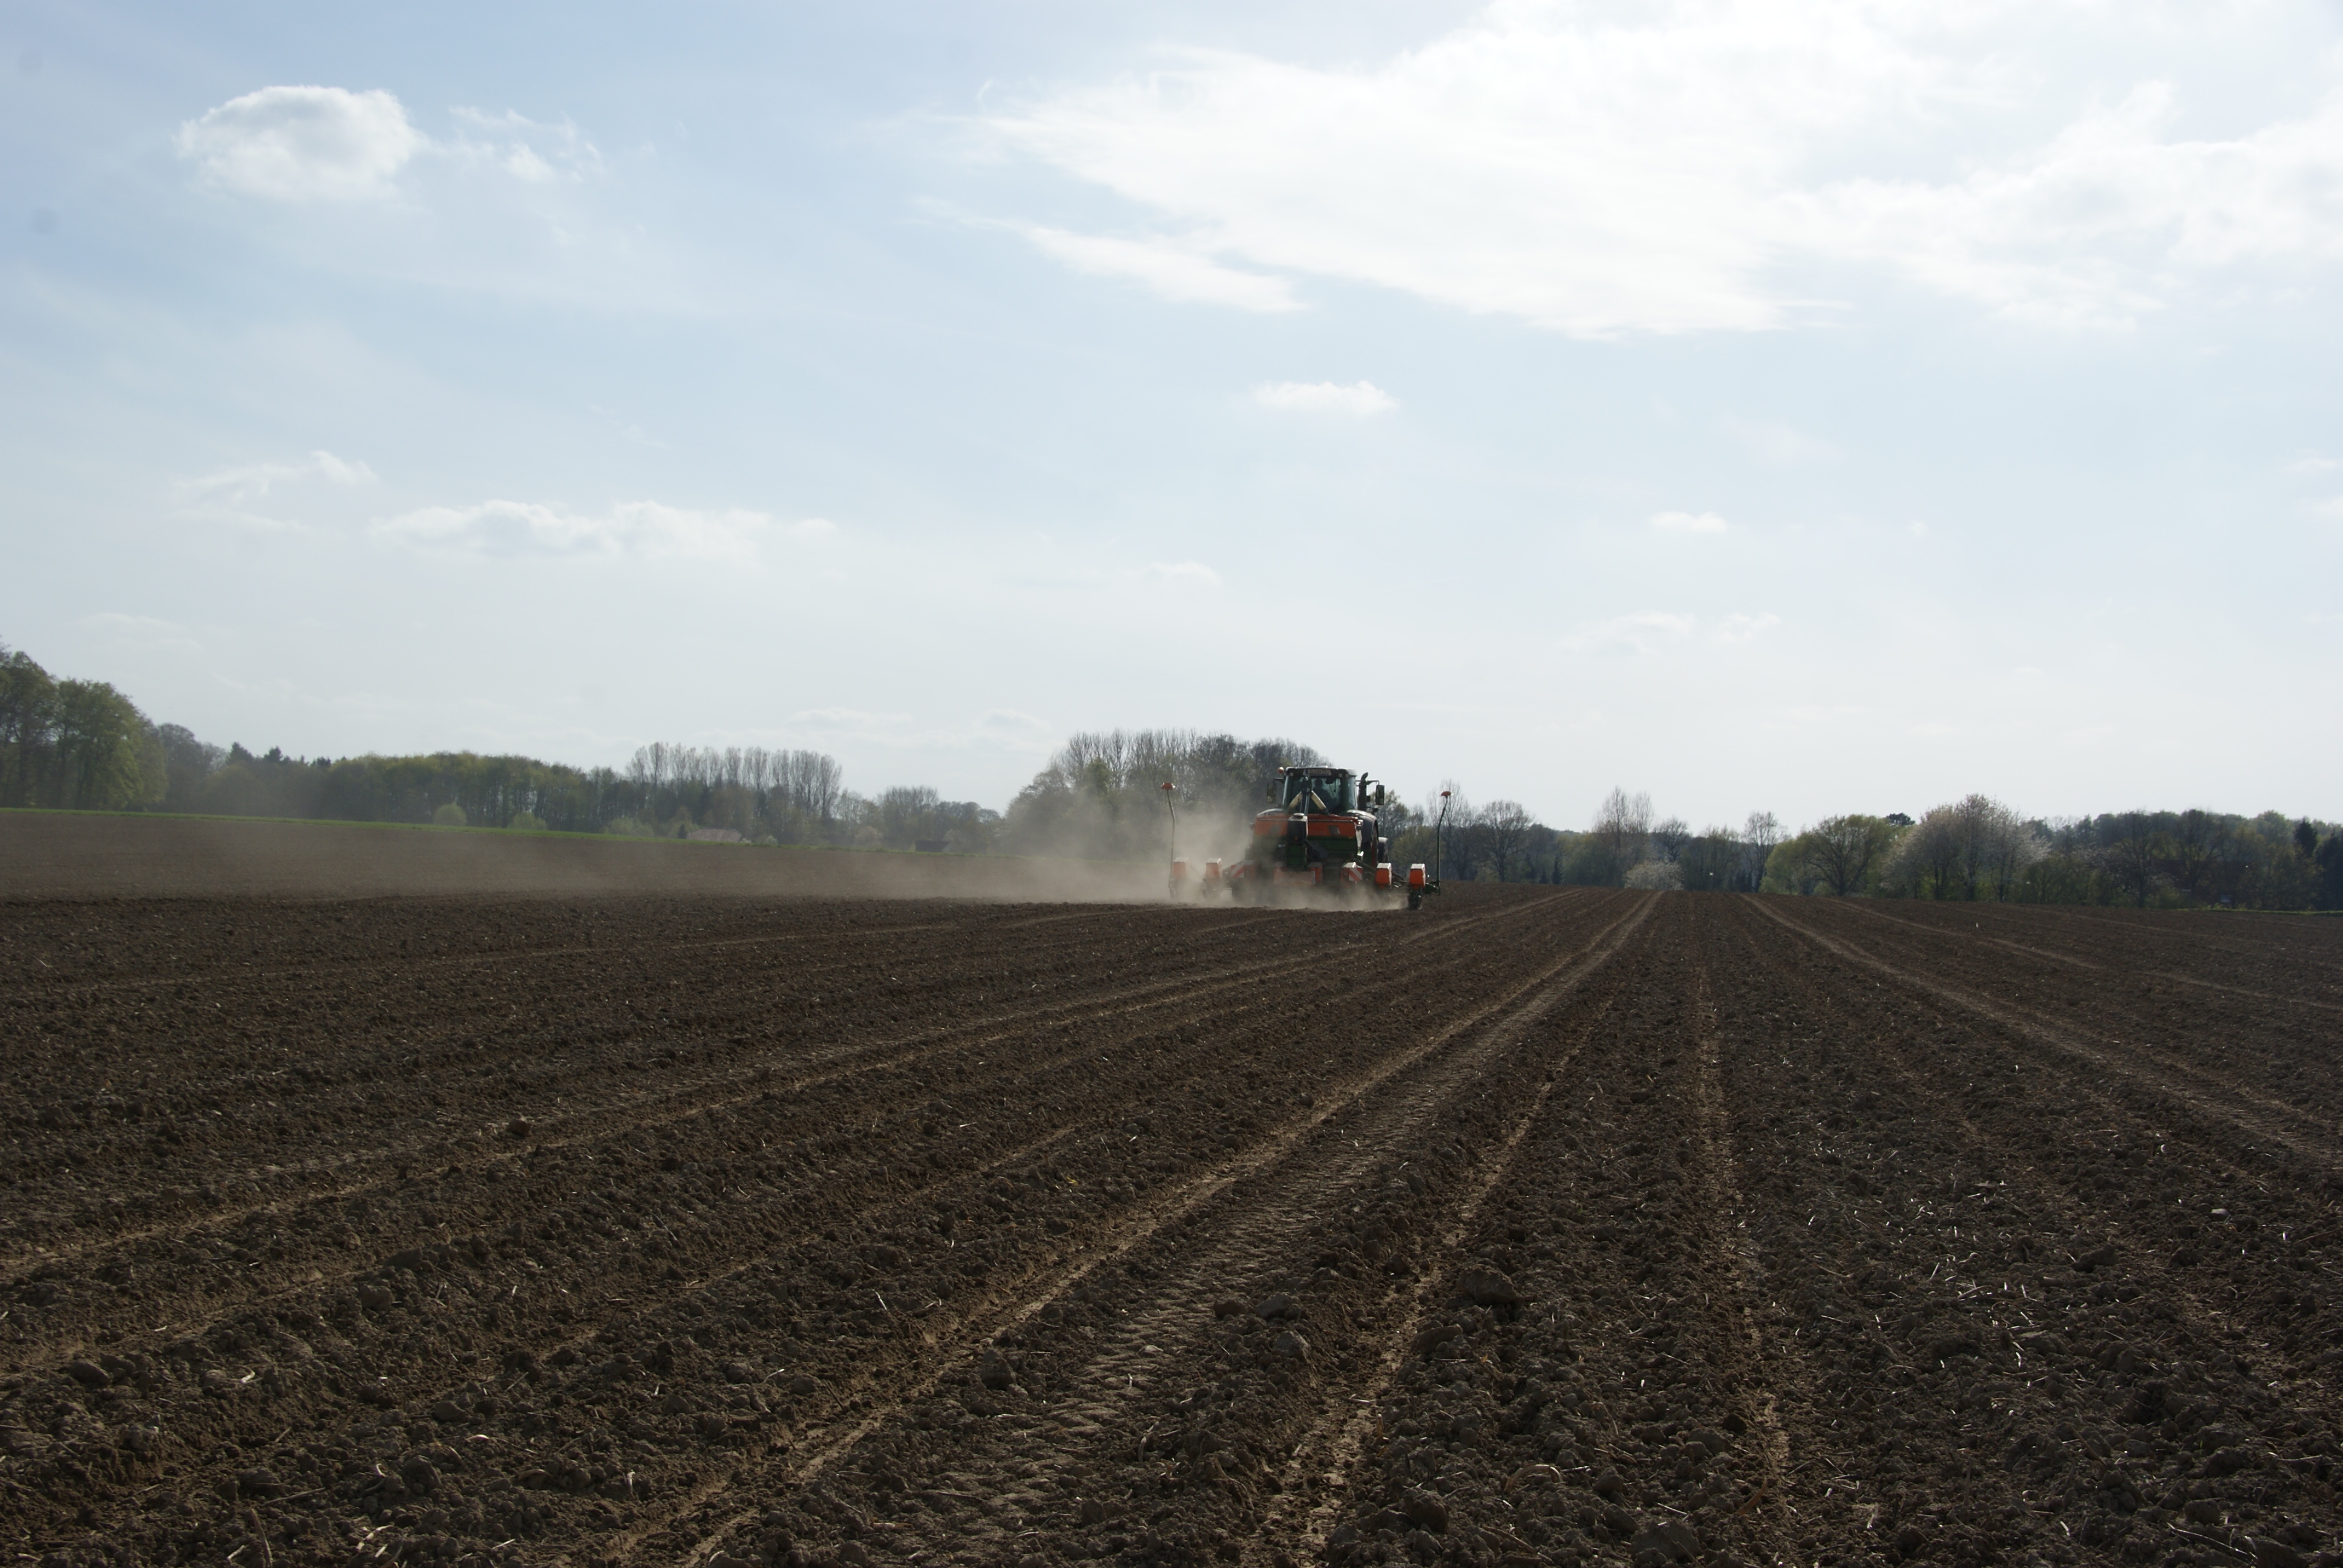
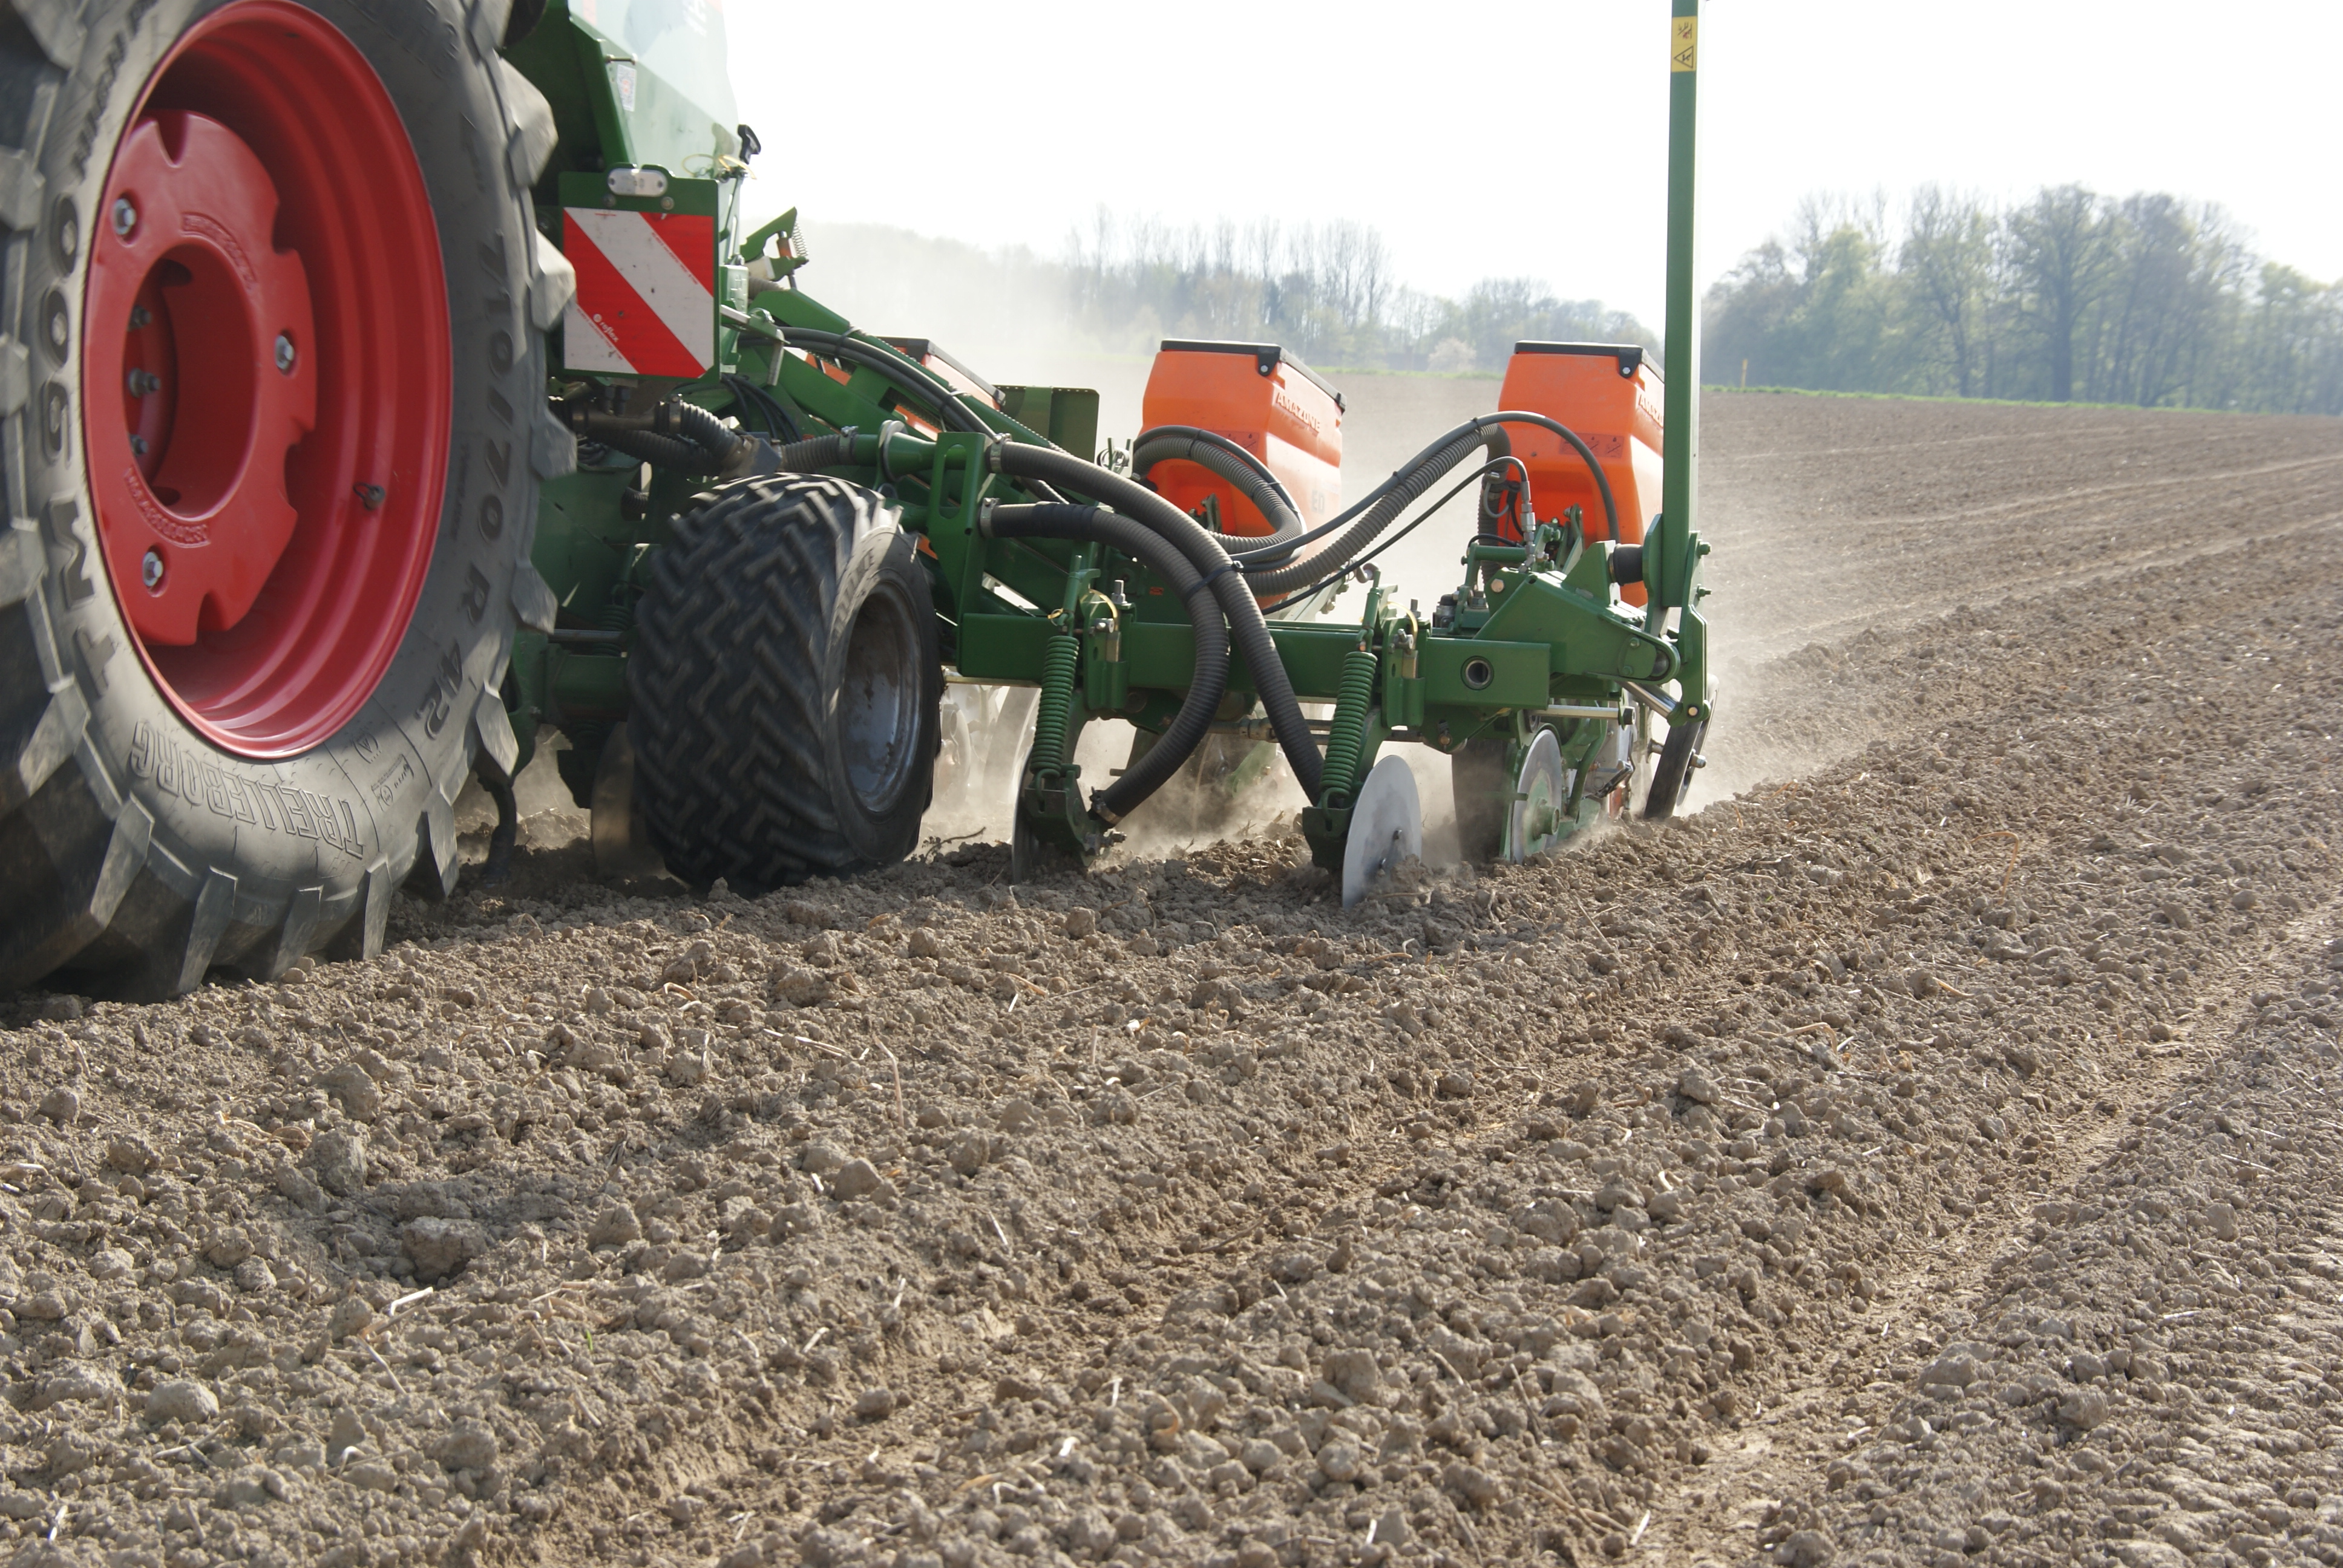
When you adapt your seed rate to location and variety, you lay the foundation for reliable high yields.
The seed rate (grains/m²) can be calculated directly from the plant density (plants/m²). The seed rate is always greater than the target number of the desired plants. Under normal conditions, a 95% field emergence can be assumed.
The following formula can be used to calculate the seed rate:
Grains/m² = (plants/m²/field emergence) x 100
Overview of the different seed rates
The following table shows the required seed rate in grains/m² depending on the target plant density at 95% field emergence. In addition, the table shows the distance from grain to grain within the row at different row widths.
In the right column, you can see the seed requirement in units per hectare.
In the case of early sowing and under difficult conditions, the number of seeds to be sown should be about 10% higher than the plant density.
|
Plants/m2 |
Grains/m2 |
Planting in the row in cm |
Units/ha (50,000 grains) |
|
|
For 75 cm row width |
For 37.5 cm row width |
|||
|
6 |
6.3 |
21.1 |
42.2 |
1.26 |
|
6.5 |
6.8 |
19.5 |
39.0 |
1.37 |
|
7 |
7.4 |
18.1 |
36.2 |
1.47 |
|
7.5 |
7.9 |
16.9 |
33.8 |
1.58 |
|
8 |
8.4 |
15.8 |
31.7 |
1.68 |
|
8.5 |
8.9 |
14.9 |
29.8 |
1.79 |
|
9 |
9.5 |
14.1 |
28.1 |
1.89 |
|
9.5 |
10.0 |
13.3 |
26.7 |
2.00 |
|
10 |
10.5 |
12.7 |
25.3 |
2.11 |
|
10.5 |
11.1 |
12.1 |
24.1 |
2.21 |
|
11 |
11.6 |
11.5 |
23.0 |
2.32 |
|
11.5 |
12.1 |
11.0 |
22.0 |
2.42 |
|
12 |
12.6 |
10.6 |
21.1 |
2.53 |
Managing seed rate and plant density in maize
The seed rate or the plant density are determined by counting the stored grains or accumulated plants. The seed rate must be monitored already while sowing in order to be able to correct any errors immediately. The actual plant density can be determined only after the sprouting of the plants by counting the young maize plants.
There are two methods for this:
- The deposited grains or accumulated plants are counted in 10 randomly selected rows at different points of the field
- The counting distance per row is 5 m
|
Detected grains/plants per 5m row |
Plant density at a row width of |
|||
|
75cm |
70cm |
50cm |
37.5cm |
|
|
10 |
- |
- |
- |
5.3 |
|
12 |
- |
- |
- |
6.4 |
|
14 |
- |
- |
5.6 |
7.5 |
|
16 |
- |
- |
6.4 |
8.5 |
|
18 |
- |
- |
7.2 |
9.6 |
|
20 |
- |
5.7 |
8.0 |
10.7 |
|
22 |
5.9 |
6.3 |
8.8 |
11.7 |
|
24 |
6.4 |
6.9 |
9.6 |
12.8 |
|
26 |
6.9 |
7.4 |
10.4 |
- |
|
28 |
7.5 |
8.0 |
11.2 |
- |
|
30 |
8.0 |
8.6 |
12.0 |
- |
|
32 |
8.5 |
9.1 |
12.8 |
- |
|
34 |
9.1 |
9.7 |
- |
- |
|
36 |
9.6 |
10.3 |
- |
- |
|
38 |
10.1 |
10.9 |
- |
- |
|
40 |
10.7 |
11.4 |
- |
- |
|
42 |
11.2 |
12.0 |
- |
- |
|
44 |
11.7 |
12.6 |
- |
- |
|
46 |
12.3 |
- |
- |
- |
Source: KWS SAAT SE & Co. KGaA
In order to determine the plant density, the accumulated plants are counted on a counting line of 1.33 m. This procedure should be repeated in at least five different rows before the average of these counts is determined.
This average indicates the number of grains or plants/m². With a row distance of 75 cm, the number of grains or plants is 1.33 m in the row of the number of grains or plants/m² (0.75 cm x 1.33 m = 1 m²). However, this method involves some inaccuracy, since a rounding error accrues. The result, however, represents a very good, quickly ascertainable reference value.


